📌 Project Objective
To analyze website performance metrics using Python libraries like Pandas, Matplotlib, and SciPy. This project identifies patterns in website speed, throughput, response time, and category performance to support real cloud optimization decisions such as auto scaling, monitoring, SLA management, and user experience enhancement.
📂 Dataset Details
| Total Rows | Total Columns | File Name | File Type |
|---|---|---|---|
| 734 | 9 | labeled_dataset.csv | CSV |
| Column Names |
|---|
| Sr No |
| website_url |
| Category |
| Page Size (KB) |
| Load Time(s) |
| Response Time(s) |
| Throughput |
| Performance_Label |
| User Response |
⚙️ Python Workflow Used
- Load dataset using Pandas
- Clean duplicate & null values
- Standardize text labels
- Generate descriptive statistics
- Create visualizations
- Perform T-Test
- Perform Chi-Square Test
📄 STEP 1: Load Dataset
🧹 STEP 2: Clean Dataset
✔ Dataset cleaned successfully.
📊 STEP 3: Descriptive Statistics
| Metric | Load Time(s) | Response Time(s) | Throughput |
|---|---|---|---|
| Count | 733 | 733 | 733 |
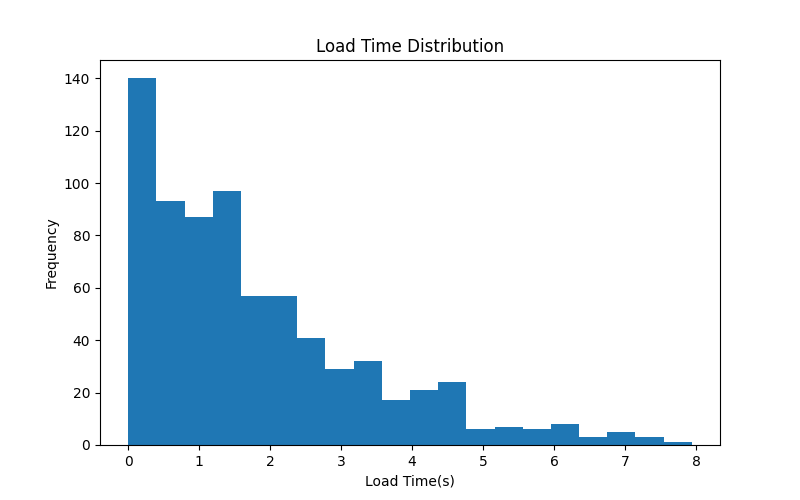
| Mean | 1.786 | 1.013 | 317.69 |
| Median | 1.38 | 0.599 | 97.30 |
| Max | 7.94 | 7.419 | 15227.28 |
✔ Statistical summary generated.
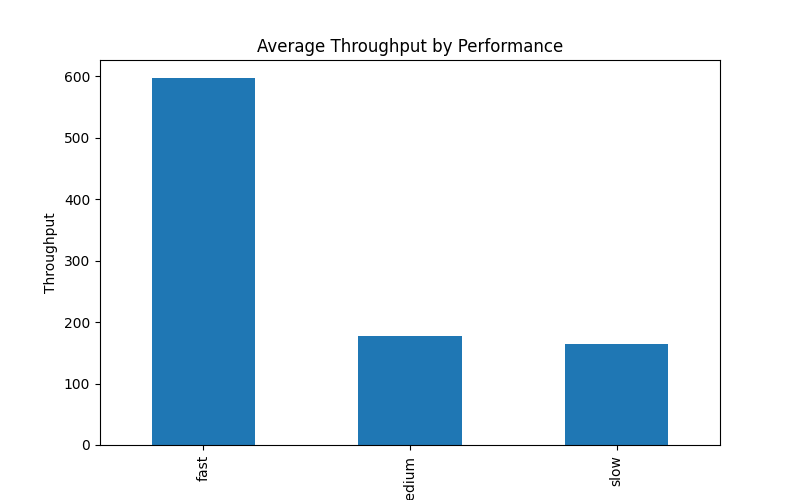
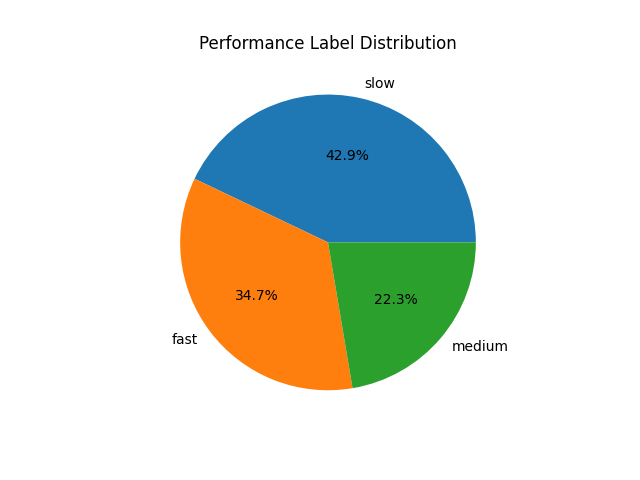
📈 STEP 4: Visualizations
1. Load Time Distribution
2. Average Throughput by Performance Label
3. Performance Label Distribution
✔ Graphs generated successfully.
🧪 STEP 5: Hypothesis Test 1
Interpretation: Website speed categories differ significantly. This helps cloud teams identify slow services and optimize resources.
🧪 STEP 6: Hypothesis Test 2
Interpretation: Website type (E-commerce, Travel, Media etc.) influences performance behavior.
☁️ Real Cloud Computing Use Cases
| Metric | Cloud Use Case |
|---|---|
| Load Time | Auto Scaling Decisions |
| Response Time | Latency Monitoring |
| Throughput | Load Balancer Analysis |
| Performance_Label | SLA Monitoring |
| Category | Capacity Planning |
✅ Final Conclusion
This project successfully performed end-to-end statistical analysis on a website performance dataset using Python. The dataset was cleaned, visualized, and tested using T-Test, ANOVA, and Chi-Square methods.
- Fast and Slow websites differ significantly
- All performance groups show meaningful variation
- Website category affects speed behavior
- Useful for cloud optimization decisions
- Improves user experience and system efficiency